Promotional Effectiveness
Three Datapoints That May Change Your HCP Promotional Channel Mix Forever
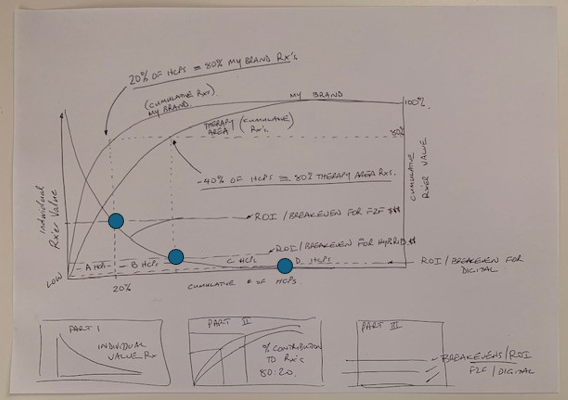
I was reminded of the importance of the fundamentals of Customer Value, Promotional Investment and Return on Promotional Investment in the context of HCP Promotional strategies while explaining the visual below to a Client. By calculating three datapoints (shown as the blue dots in the chart below) you could significantly improve your HCP promotional channel mix strategy (and more) moving forward.
I will walk you through how to calculate these three datapoints and how you can use this information to reconsider your HCP multichannel promotional strategy for any Brand.
Part 1 - Individual Rxer Value
Each HCP drives a measurable $ value for your Brand. The same applies for their value across competitors.
Stack rank every HCP from highest to lowest Rxer Value and plot their individual Rxer value on the primary y axis vs cumulative HCP count on the X axis to produce Chart 1.
Part 2 - Cumulative Rxer Value
Plot the cumulative Rxer Value on the secondary Y axis vs cumulative HCP count on the x axis will produce Chart 2. You can do the same for Therapy Area (TA) by measuring Rxer value for your Brand & competitors in your TA.
Part 3 - Breakeven / Return on Promotional Investment (ROPI)
The cost of a Medical Rep/ MSL Face to Face (F2F) Interaction is well understood – typically calculated as USD200/ call. Similarly, the cost of other channels (Webinar, Conference, Email, Phone Call, Txt Message, Journal Ads, Website impressions….) is also well known.
Brand plans include specific strategies to drive a certain number of engagements across channels per HCP per annum and therefore the cost of each strategy can be calculated per HCP. Breakeven costs can be determined based on specific multichannel strategies per HCP /Segment.
Assuming a Brand develops promotional strategies for 3-4 HCP Segments, they can also calculate the breakeven for each HCP Segment based on channel cost & frequency of engagement planned per channel.
Factoring for Return on Promotional Investment (ROPI)
It is important to factor in an expected ROPI to Part 3 – typically 4-5 X Breakeven, so the lines used in Chart 3 reflect the ROPI values per Segment (rather than breakeven).
Overlaying these three graphs will help you achieve the following;
- Identify the % of HCPs who's individual Rxer value >= Planned cost of promotion *Factoring (ROPI)
- Modelling to consider different channel mix strategies per HCP Segment
- Resource requirement vs strategy (to determine the right number of people and overall resource) vs current/ planned resource
- Understanding of Rxer value required to drive positive ROPI, which can be calculated back to individual HCP data (e.g. number of patients treated/ Rxs per month) and used as profiling questions/ data validation
What next?
This article is intended as a starting point to help the reader determine points 1-4 above. It deliberately does not tackle such factors as prescriber potential, channel impact versus channel cost, cost trade-offs or data gaps within an organisation to drive this model (channel preference/ Rxer value data….)
If you would like to better understand the concepts outlined here and more, feel free to reach out to Varese Group
Loading comments…